Business Insider
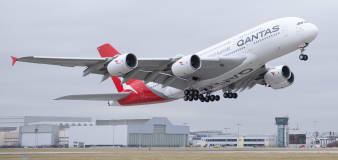
Qantas will pay up to about $79 million to resolve claims it sold tickets for canceled flights
Associated Press
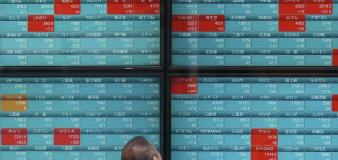
Stock market today: Asian shares track Wall St's advance fueled by cooler jobs data
Fortune
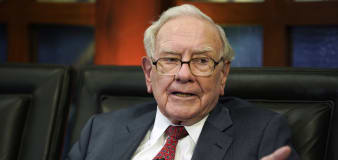
US economy is headed for a hard landing, and Fed rate cuts won’t be enough, Citi says
CNN Business
Embattled ABC News President Kim Godwin steps down after tumultuous run
Business Insider
A product manager who worked at Meta and Google reveals which company is best for work-life balance
Advertisement


Welcome to the Finance section, your ultimate source for all things money-related. Join us as we cover personal finance, investing, business news, and global economic trends. Stay up to date with the latest market news, stock prices, investment opportunities, and gain valuable insights into managing your finances and growing your wealth.


