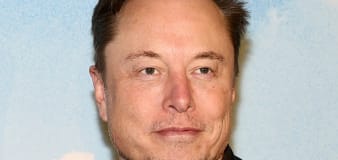
U.S. Markets open in 50 hrs, 51 mins
| Symbol | Value | Change | Percentage Change |
|---|---|---|---|
| DJIA | 8,280.74 | -223.32 | -2.63% |
| NASDAQ | 1,796.52 | -49.20 | -2.67% |
| S&P 500 | 896.42 | -26.91 | -2.91% |
Experience real-time quotes &
news with the most powerful
iPhone application for investors.
| Day Low | 19.65 12:24 PM EDT | |
|---|---|---|
| Day High | 20.74 04:04 PM EDT |
|
| Range | 1.09 |
| Volume | 598,301 | |
|---|---|---|
| 30-Day Avg Vol | 1.12 M |
|
| Difference | -46.77% |
| Market Cap | 1.14 B | |
|---|---|---|
| Mkt Cap Chg | -75.64 M |
| Shares Out | 58.19 M | |
|---|---|---|
| % Shrs Traded | 1.03% | |
| 1yr EPS Est | 1.284 |
| 52-Wk Low | 10.77 11/20/08 | |
|---|---|---|
| 52-Wk High | 33.64 9/19/08 |
|
| Range | 22.87 |
| Prev Close | 21.02 7/1/09 | |
|---|---|---|
| Today's Open | 20.74 | |
| Change | -1.33% |
| Dividend (TTM) | 1.00 | |
|---|---|---|
| Div Yield (TTM) | 4.84% | |
| Ex-Div Date | 06/05/2009 | |
| Div Date | 06/30/2009 |
|
| Short Interest | 11.01 M |
| Revenue (LFY) | 5.12 B | |
|---|---|---|
| Earnings (LFY) | 75.92 M | |
| Earnings (MRQ) | -2.69 M | |
| Next Earn Est | 0.093 | |
| Next Earnings | 08/20/2009 |
|
| EPS (TTM) | 1.33 | |
| 1yr EPS Growth | -14.40% |
| P/E Ratio (TTM) | 13.51 | |
|---|---|---|
| P/E Ratio (Fwd) | 15.00 | |
| PEG Ratio | — | |
| Return on Equity | 8.00 | |
| Beta | 1.03 |
| Sector | Services | |
|---|---|---|
| Industry | Specialty Retail |
above for more infoBarnes & Noble does business -- big business -- by the book. As the #1 bookseller in the US, it operates about 720 Barnes & Noble superstores (selling books, music, movies, and gifts) throughout all 50 ... View Full Description

| Earnings/Share(EPS) | Estimate | Actual | Difference |
|---|---|---|---|
| Next Quarter | 0.093 8/20/09 | — — |
—
—
|
| Last Quarter | -0.154 4/30/09 | -0.04 4/30/09 |
0.114
Beat
|
| 2 Quarters Ago | 1.484 1/31/09 | 1.57 1/31/09 |
0.086
Beat
|
| Quarterly - 05/02/2009 | Annual - 2008 | |
|---|---|---|
| Total Revenue | 1.11 B | 5.12 B |
| Gross Profit | 285.78 M | 1.41 B |
| Operating Income | -3.24 M | 155.05 M |
| Net Income | -2.69 M | 75.92 M |
Notices and Terms: Confirm all data with your broker before trading.
BATS data provided in real-time. NYSE, NASDAQ and AMEX data delayed 15 minutes.
Quote data provided by Interactive Data. Real-Time prices provided by BATS. Historical prices provided by Prophet. Company Profile provided by Hoovers. Executive data and Industry/Sector information provided by Morningstar Inc. Earnings, Ownership, Financial Statement, Insider Trading, Conference Call schedules and SEC Filing information provided by Thomson Reuters.