CBS News
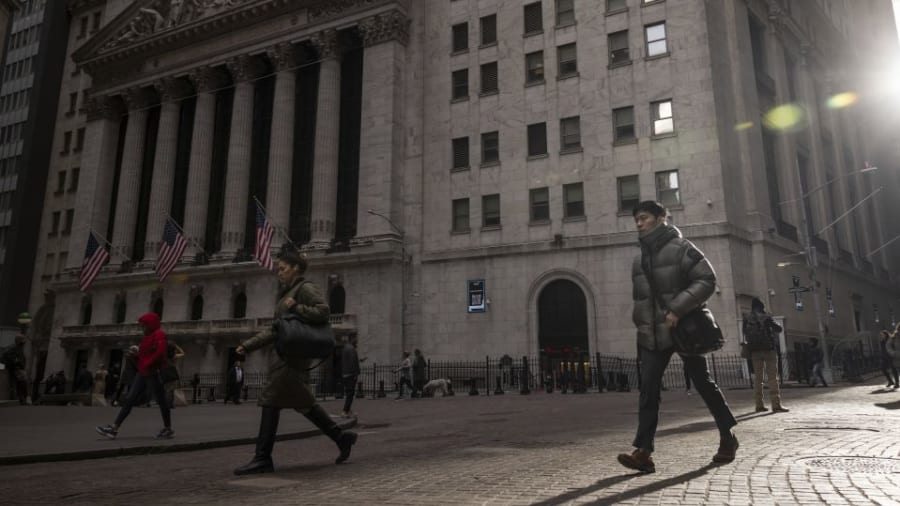
U.S. economic growth slows as consumers tighten their belts
CNN Business
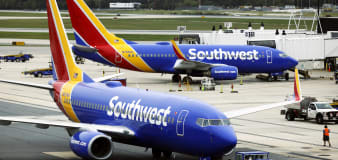
Boeing problems lead Southwest to drop service to four airports
NBC Universal
Red Lobster seeks a buyer as it looks to avoid bankruptcy filing
Business Insider
Mark Zuckerberg's wealth may slide $25 billion in a day as Big Tech faces $350 billion sell-off
Yahoo Finance
TikTok vows to take US ban bill to the courts. It faces an uphill climb.
Advertisement


Welcome to the Finance section, your ultimate source for all things money-related. Join us as we cover personal finance, investing, business news, and global economic trends. Stay up to date with the latest market news, stock prices, investment opportunities, and gain valuable insights into managing your finances and growing your wealth.


