NBC Universal
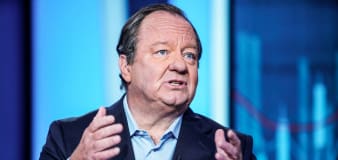
Paramount CEO Bob Bakish could be out as soon as Monday as Skydance merger talks continue
Reuters
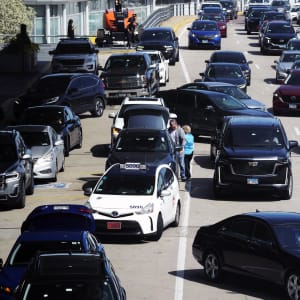
Elon Musk visits China as Tesla seeks self-driving technology rollout
Yahoo Finance
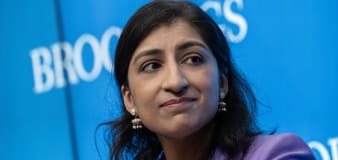
FTC's noncompete ban could reshape the US workplace
Yahoo Finance
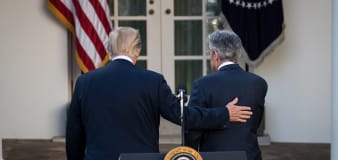
Could Jerome Powell be fired? It's an open legal question Trump could test.
Fox Business
Williams Sonoma labeled Chinese-made merchandise American made; ordered to pay over $3M
Advertisement


Welcome to the Finance section, your ultimate source for all things money-related. Join us as we cover personal finance, investing, business news, and global economic trends. Stay up to date with the latest market news, stock prices, investment opportunities, and gain valuable insights into managing your finances and growing your wealth.