Business Insider
Memecoins are back, and the returns are so big that even hedge funds can't resist
Yahoo Finance
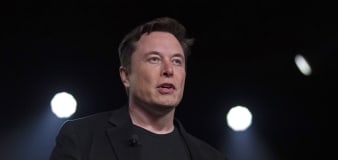
Elon Musk insists Tesla isn’t a car company as sales falter
NBC Universal
Biden signs a bill that could ban TikTok — after the 2024 election
Yahoo Finance
Ford earnings preview: Guidance update, shifting product strategy key for investors
Business Insider
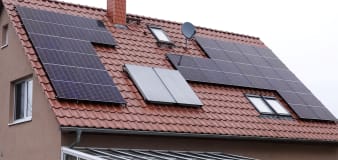
The US is preparing to hit back at China's glut of cheap solar panels by targeting its allies
Advertisement


Welcome to the Finance section, your ultimate source for all things money-related. Join us as we cover personal finance, investing, business news, and global economic trends. Stay up to date with the latest market news, stock prices, investment opportunities, and gain valuable insights into managing your finances and growing your wealth.


