CNN Business
Pilot union alleges ‘significant spike’ in safety issues on American Airlines flights
Business Insider
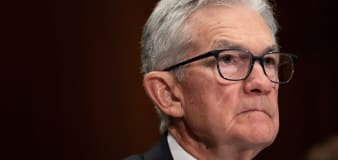
Stock market today: US indexes mixed amid hawkish Fedspeak and spiking bond yields
CNN Business
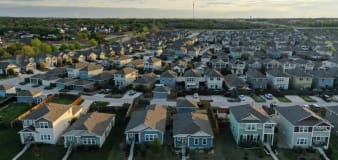
Here’s what would happen to the US economy if there are no rate cuts this year
Associated Press
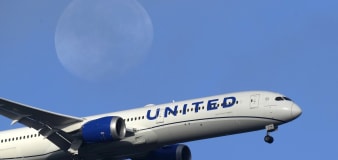
United Airlines reports $124M loss in quarter marred by grounding of some Boeing planes
Yahoo Finance
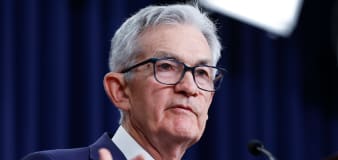
Powell says taking 'longer than expected' for inflation to reach Fed's 2% target
Advertisement


Welcome to the Finance section, your ultimate source for all things money-related. Join us as we cover personal finance, investing, business news, and global economic trends. Stay up to date with the latest market news, stock prices, investment opportunities, and gain valuable insights into managing your finances and growing your wealth.


