CNN Business
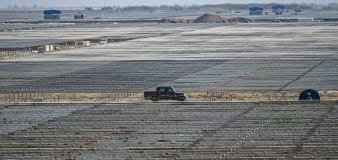
A coal billionaire is building the world’s biggest clean energy plant and it’s five times the size of Paris
NBC Universal
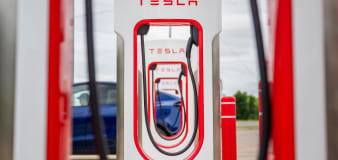
Intel used to dominate the chip industry. Now it's struggling to stay relevant
Associated Press
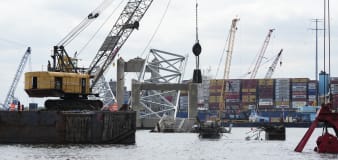
Businesses hindered by bridge collapse should receive damages, court filing argues
Bankrate
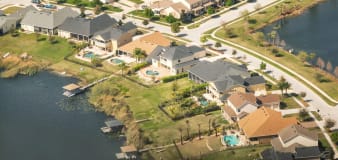
Cost of living facts and statistics 2024
Associated Press
JPMorgan's Dimon hopes for soft landing for US economy but says stagflation is a possible scenario
Advertisement


Welcome to the Finance section, your ultimate source for all things money-related. Join us as we cover personal finance, investing, business news, and global economic trends. Stay up to date with the latest market news, stock prices, investment opportunities, and gain valuable insights into managing your finances and growing your wealth.


