Business Insider
The FTC says Jeff Bezos and Amazon execs used Signal to talk business — and it wants to know more
NBC Universal
Meta's big, expensive AI bet hinges on giving its models away for free
Yahoo Finance
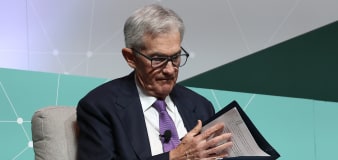
Fed's favored inflation gauge shows price increases remained sticky in March
CNN Business
Stagflation fears just hit Wall Street. Now for the next crucial report on prices
Associated Press
Online retailer Shein is latest to face strict European Union digital regulations
Advertisement


Welcome to the Finance section, your ultimate source for all things money-related. Join us as we cover personal finance, investing, business news, and global economic trends. Stay up to date with the latest market news, stock prices, investment opportunities, and gain valuable insights into managing your finances and growing your wealth.


