Reuters
Trump poised to clinch $1.3 billion social media company stock award
Business Insider
TikTok influencers fear their careers will be destroyed and their work 'deleted forever' as a US ban looms
Business Insider
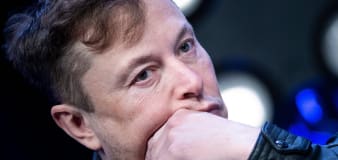
Elon Musk's wealth has crashed by over $175 billion from its peak as Tesla's problems pile up
Associated Press
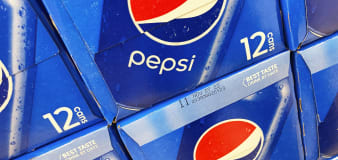
Pepsi beats Q1 revenue forecasts as price increases moderate
Associated Press
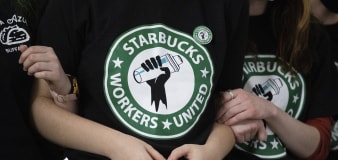
Starbucks takes on the federal labor agency before the US Supreme Court
Advertisement


Welcome to the Finance section, your ultimate source for all things money-related. Join us as we cover personal finance, investing, business news, and global economic trends. Stay up to date with the latest market news, stock prices, investment opportunities, and gain valuable insights into managing your finances and growing your wealth.