CNN Business
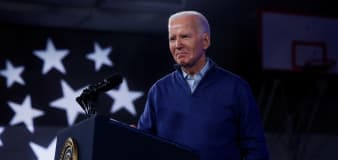
Biden praises UAW-Daimler Truck agreement as a ‘testament to the power of collective bargaining’
Yahoo Finance
The AI trade is back, as confidence in Big Tech surges
Yahoo Finance
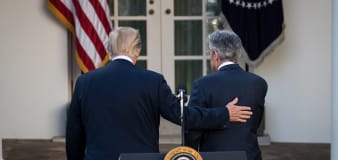
A Fed meeting, jobs report, and more Big Tech earnings: What to know this week
CNN Business
Say goodbye to Ruby Tuesday and Chili’s. These are the hot new restaurants at the mall
NBC Universal
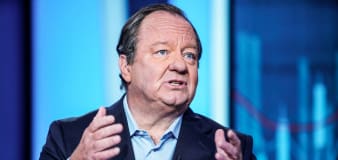
Paramount CEO Bob Bakish could be out as soon as Monday as Skydance merger talks continue
Advertisement


Welcome to the Finance section, your ultimate source for all things money-related. Join us as we cover personal finance, investing, business news, and global economic trends. Stay up to date with the latest market news, stock prices, investment opportunities, and gain valuable insights into managing your finances and growing your wealth.