NBC Universal
Trump Media auditor charged by SEC with 'massive fraud,' barred from public company audits
CNN Business
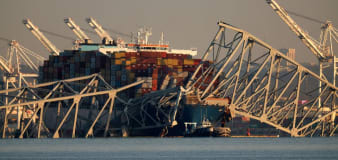
The company that rebuilt Genoa bridge is offering to do the same for Baltimore
CNN Business
Rue21, a mall staple, files for bankruptcy and will close all of its stores
CNN Business
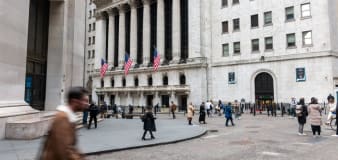
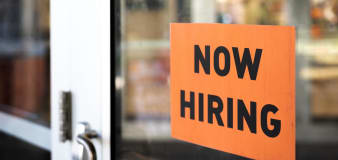
Markets jump higher after softer-than-expected jobs report fuels hopes of an earlier rate cut
Yahoo Finance
11 stocks that mattered most this earnings season
Advertisement


Welcome to the Finance section, your ultimate source for all things money-related. Join us as we cover personal finance, investing, business news, and global economic trends. Stay up to date with the latest market news, stock prices, investment opportunities, and gain valuable insights into managing your finances and growing your wealth.


