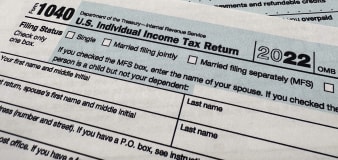
U.S. Markets open in 13 hrs, 4 mins
| Symbol | Value | Change | Percentage Change |
|---|---|---|---|
| DJIA | 10,023.42 | 17.46 | 0.17% |
| NASDAQ | 2,112.44 | 7.12 | 0.34% |
| S&P 500 | 1,069.30 | 2.67 | 0.25% |
Experience real-time quotes &
news with the most powerful
iPhone application for investors.
| Day Low | 7.00 01:09 PM EST | |
|---|---|---|
| Day High | 7.72 09:45 AM EST |
|
| Range | 0.72 |
| Volume | 400,857 | |
|---|---|---|
| 30-Day Avg Vol | 551,000 |
|
| Difference | -27.25% |
| Market Cap | 363.26 M | |
|---|---|---|
| Mkt Cap Chg | -7.54 M |
| Shares Out | 50.31 M | |
|---|---|---|
| % Shrs Traded | 0.80% | |
| 1yr EPS Est | -0.85 |
| 52-Wk Low | 3.13 | |
|---|---|---|
| 52-Wk High | 8.37 |
|
| Range | 5.24 |
| Prev Close | 7.37 11/5/09 | |
|---|---|---|
| Today's Open | 7.48 | |
| Change | 1.49% |
| Dividend (TTM) | 0.00 | |
|---|---|---|
| Div Yield (TTM) | 0.00% | |
| Ex-Div Date | — | |
| Div Date | — |
|
| Short Interest | 1.13 M |
| Revenue (LFY) | 610.88 M | |
|---|---|---|
| Earnings (LFY) | -62.74 M | |
| Earnings (MRQ) | -6.26 M | |
| Next Earn Est | -0.25 | |
| Next Earnings | 02/22/2010 |
|
| EPS (TTM) | -1.98 | |
| 1yr EPS Growth | -1,314.29% |
| P/E Ratio (TTM) | — | |
|---|---|---|
| P/E Ratio (Fwd) | -8.00 | |
| PEG Ratio | -0.64 | |
| Return on Equity | -14.51 | |
| Beta | 1.84 |
| Sector | Basic Materials | |
|---|---|---|
| Industry | Energy |
above for more infoPioneer Drilling digs down deep to make money from beneath the land where Texas pioneers used to roam. The company, formerly South Texas Drilling & Exploration, provides contract drilling services to oil ... View Full Description

| Earnings/Share(EPS) | Estimate | Actual | Difference |
|---|---|---|---|
| Next Quarter | -0.25 2/22/10 | — — |
—
—
|
| Last Quarter | -0.219 9/30/09 | -0.18 9/30/09 |
0.039
Beat
|
| 2 Quarters Ago | -0.18 6/30/09 | -0.13 6/30/09 |
0.05
Beat
|
| Quarterly - 06/30/2009 | Annual - 2008 | |
|---|---|---|
| Total Revenue | 69.12 M | 610.88 M |
| Gross Profit | -292,000.00 | 172.80 M |
| Operating Income | -9.27 M | 127.54 M |
| Net Income | -6.26 M | -62.74 M |
Notices and Terms: Confirm all data with your broker before trading.
BATS data provided in real-time. NYSE, NASDAQ and AMEX data delayed 15 minutes.
Quote data provided by Interactive Data. Real-Time prices provided by BATS. Historical prices provided by Prophet. Company Profile provided by Hoovers. Executive data and Industry/Sector information provided by Morningstar Inc. Earnings, Ownership, Financial Statement, Insider Trading, Conference Call schedules and SEC Filing information provided by Thomson Reuters.