CNN Business
AstraZeneca withdraws Covid-19 vaccine citing low demand
Reuters
Bill Hwang's trial begins over collapse of his $36 billion Archegos fund
Associated Press
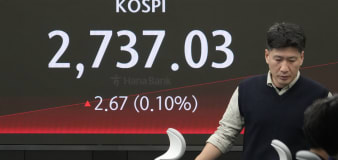
Stock market today: Global shares mostly higher after calm day on Wall St
Associated Press
Toyota racks up booming profit, vows to invest to keep growth going
Yahoo Finance
Stock buybacks hit highest level since 2018
Advertisement


Welcome to your ultimate source for all things money-related. Join us as we cover personal finance, investing, business news, and global economic trends. Learn how to budget, save money on your TV watching, or find apps to help with managing your finances and growing your wealth.


