Associated Press
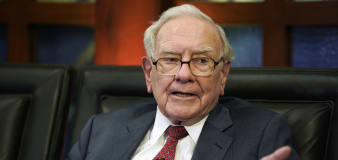
Berkshire Hathaway board feels sure Greg Abel is the man to eventually replace Warren Buffett
NBC Universal
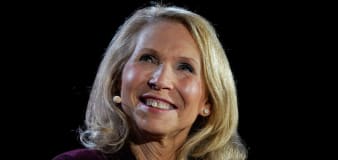
Sony and Apollo send letter expressing interest in $26B Paramount buyout
Benzinga
Starbucks CEO's dilemma unfolds with stock performance, falling sales
Business Insider
Stock market today: Stocks rally ahead of big April jobs report
CBS News
Peloton, once hailed as the future of fitness, is now sucking wind
Advertisement


![‘[Stocks] are very unsafe for tomorrow': Warren Buffett once revealed the biggest risk with the US stock market — here's what it is and how to capitalize for big riches](https://s.aolcdn.com/images/dims?thumbnail=338%2C160%2Cauto&image_uri=https%3A%2F%2Fmedia.zenfs.com%2Fen%2Faol_moneywise_380%2F635124d15f48b5e5ee07778d8c83499b&client=76f99bdb8f78cd44cc0b&signature=5776e713f68bff76120e86478cdab1605c5647b6)
![‘[Stocks] are very unsafe for tomorrow': Warren Buffett once revealed the biggest risk with the US stock market — here's what it is and how to capitalize for big riches](https://s.aolcdn.com/images/dims?thumbnail=16%2C16%2Cauto&image_uri=https%3A%2F%2Fs.yimg.com%2Fos%2Fcreatr-uploaded-images%2F2023-11%2F482ab9a0-7dbb-11ee-bdd7-b11fbe01bff1&client=76f99bdb8f78cd44cc0b&signature=dd57ba74d68705d4271b84c9abc4f77dd97b1a8e)


Welcome to the Finance section, your ultimate source for all things money-related. Join us as we cover personal finance, investing, business news, and global economic trends. Stay up to date with the latest market news, stock prices, investment opportunities, and gain valuable insights into managing your finances and growing your wealth.


