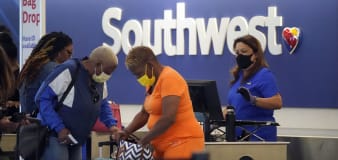
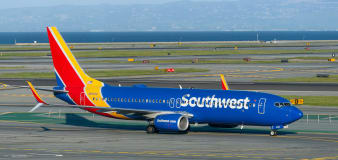
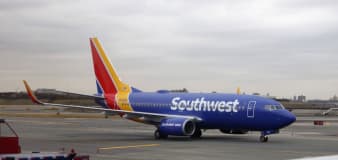
U.S. Markets open in 10 hrs, 34 mins
| Symbol | Value | Change | Percentage Change |
|---|---|---|---|
| DJIA | 10,023.42 | 17.46 | 0.17% |
| NASDAQ | 2,112.44 | 7.12 | 0.34% |
| S&P 500 | 1,069.30 | 2.67 | 0.25% |
Experience real-time quotes &
news with the most powerful
iPhone application for investors.
| Day Low | 67.56 10:32 AM EST | |
|---|---|---|
| Day High | 69.3996 09:48 AM EST |
|
| Range | 1.84 |
| Volume | 2.16 M | |
|---|---|---|
| 30-Day Avg Vol | 3.91 M |
|
| Difference | -44.58% |
| Market Cap | 19.17 B | |
|---|---|---|
| Mkt Cap Chg | -317.61 M |
| Shares Out | 281.07 M | |
|---|---|---|
| % Shrs Traded | 0.77% | |
| 1yr EPS Est | 1.604 |
| 52-Wk Low | 24.27 | |
|---|---|---|
| 52-Wk High | 76.05 |
|
| Range | 51.78 |
| Prev Close | 69.35 11/5/09 | |
|---|---|---|
| Today's Open | 68.59 | |
| Change | -1.10% |
| Dividend (TTM) | 2.70 | |
|---|---|---|
| Div Yield (TTM) | 3.52% | |
| Ex-Div Date | 11/12/2009 | |
| Div Date | 12/18/2009 |
|
| Short Interest | 48,499.00 |
| Revenue (LFY) | 3.78 B | |
|---|---|---|
| Earnings (LFY) | 463.64 M | |
| Earnings (MRQ) | 112.09 M | |
| Next Earn Est | 0.549 | |
| Next Earnings | 01/25/2010 |
|
| EPS (TTM) | 1.37 | |
| 1yr EPS Growth | 15.40% |
| P/E Ratio (TTM) | 49.80 | |
|---|---|---|
| P/E Ratio (Fwd) | 42.00 | |
| PEG Ratio | 12.00 | |
| Return on Equity | 15.51 | |
| Beta | 1.80 |
| Sector | Financial | |
|---|---|---|
| Industry | Real Estate |
above for more infoSimon says: "Shop!" And millions do. Simon Property Group is the US's #1 shopping mall owner and one of the nation's largest publicly traded real estate companies. The self-administered real estate investment ... View Full Description

| Earnings/Share(EPS) | Estimate | Actual | Difference |
|---|---|---|---|
| Next Quarter | 0.549 1/25/10 | — — |
—
—
|
| Last Quarter | 0.351 9/30/09 | 0.38 9/30/09 |
0.029
Beat
|
| 2 Quarters Ago | 0.315 6/30/09 | -0.08 6/30/09 |
-0.395
Missed
|
| Quarterly - 09/30/2009 | Annual - 2008 | |
|---|---|---|
| Total Revenue | 924.93 M | 3.78 B |
| Gross Profit | — | 2.36 B |
| Operating Income | 134.30 M | 613.74 M |
| Net Income | 112.09 M | 463.64 M |
Notices and Terms: Confirm all data with your broker before trading.
BATS data provided in real-time. NYSE, NASDAQ and AMEX data delayed 15 minutes.
Quote data provided by Interactive Data. Real-Time prices provided by BATS. Historical prices provided by Prophet. Company Profile provided by Hoovers. Executive data and Industry/Sector information provided by Morningstar Inc. Earnings, Ownership, Financial Statement, Insider Trading, Conference Call schedules and SEC Filing information provided by Thomson Reuters.