Yahoo Finance
Gas prices: Why one US region will see 'stiff increases' this week
Associated Press
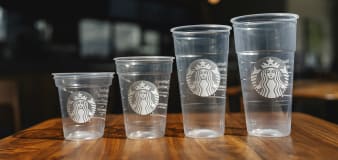
Starbucks is introducing a cold drink cup made with less plastic
Associated Press
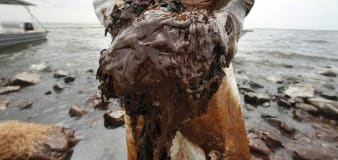
Once praised, settlement to help sickened BP oil spill workers leaves most with nearly nothing
NBC Universal
Trump Media tells shareholders how to block their DJT stock being loaned to short sellers
Reuters
US weekly jobless claims remain at low level
Advertisement


Welcome to the Finance section, your ultimate source for all things money-related. Join us as we cover personal finance, investing, business news, and global economic trends. Stay up to date with the latest market news, stock prices, investment opportunities, and gain valuable insights into managing your finances and growing your wealth.


