Fortune
Ryanair’s Michael O’Leary, who is up for a $108 million bonus, doesn’t see high CEO pay as a problem
Business Insider
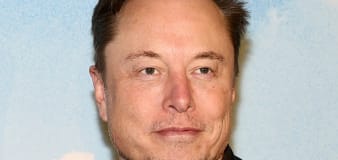
Elon Musk comes out fighting as China throws Tesla a lifeline
CNN Business
How CEOs are preparing for possible employee protests
Reuters
Futures inch up as megacaps extend gains, Fed verdict on tap
CNN Business
Elon Musk wins official praise for Tesla during surprise visit to China
Advertisement


Welcome to the Finance section, your ultimate source for all things money-related. Join us as we cover personal finance, investing, business news, and global economic trends. Stay up to date with the latest market news, stock prices, investment opportunities, and gain valuable insights into managing your finances and growing your wealth.


