NBC Universal
Alphabet issues first ever dividend, $70 billion buyback
Associated Press
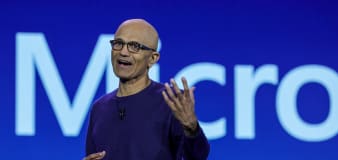
Microsoft quarterly profit rises 20% as tech giant pushes to get customers using AI products
Reuters
Snap beats first-quarter expectations, shares jump 25%
Business Insider
Nearly 1,300 stores are closing across the US. Here's the list
Reuters
ByteDance prefers TikTok shutdown in US if legal options fail, sources say
Advertisement


Welcome to the Finance section, your ultimate source for all things money-related. Join us as we cover personal finance, investing, business news, and global economic trends. Stay up to date with the latest market news, stock prices, investment opportunities, and gain valuable insights into managing your finances and growing your wealth.


