Fox Business
Ads on Facebook, Instagram for explicit 'AI girlfriends' prompt Meta crackdown
CNN Business
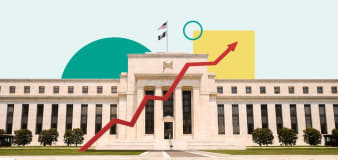
Americans were paid an additional $235 billion in interest in 2023, thanks to the Fed
Business Insider
Amazon, Microsoft, Alphabet are doubling down on AI — and it seems to be paying off
Bankrate
What the Fed’s continued rate pause means for homebuyers and sellers
NBC Universal
Long-predicted consumer pullback finally hits restaurants like Starbucks, KFC and McDonald's
Advertisement


Welcome to the Finance section, your ultimate source for all things money-related. Join us as we cover personal finance, investing, business news, and global economic trends. Stay up to date with the latest market news, stock prices, investment opportunities, and gain valuable insights into managing your finances and growing your wealth.


