Bankrate
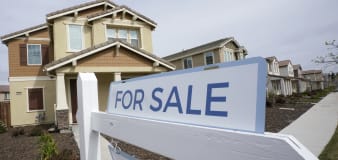
Cost of living facts and statistics 2024
Associated Press
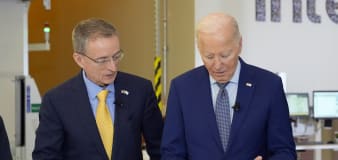
JPMorgan's Dimon hopes for soft landing for US economy but says stagflation is a possible scenario
Stacker
Cashiers vs. digital ordering: What do people want, and at what cost?
NBC Universal
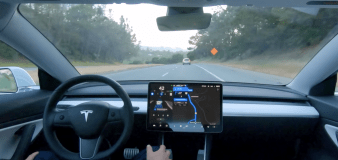
Federal regulator finds Tesla Autopilot has 'critical safety gap' linked to hundreds of collisions
Business Insider
Bank of America lays out the exact scenario that could finally pop the stock market's AI bubble
Advertisement


Welcome to the Finance section, your ultimate source for all things money-related. Join us as we cover personal finance, investing, business news, and global economic trends. Stay up to date with the latest market news, stock prices, investment opportunities, and gain valuable insights into managing your finances and growing your wealth.


