Business Insider
CEOs make the message clear on AI's big payoff: Be patient
Fortune
Hertz is done gambling with EVs: It took a first-quarter $195 million hit on Teslas
Business Insider
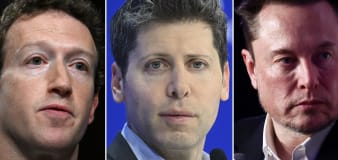
The stark contrast between Meta and Tesla earnings reactions reveals the uncanny power of Musk's promises
Fortune
UK’s Rishi Sunak wants to reform disability benefits by ending ‘sick note culture’
Business Insider
Alphabet's new dividend is helping reassure Meta-spooked tech investors
Advertisement


Welcome to the Finance section, your ultimate source for all things money-related. Join us as we cover personal finance, investing, business news, and global economic trends. Stay up to date with the latest market news, stock prices, investment opportunities, and gain valuable insights into managing your finances and growing your wealth.


